
I’ve set up a new blog site, just for air quality. You can find it here. My primary blog, Beards and Triathlons, doesn’t really work with the air quality stuff, which is why I’ve moved it all elsewhere. It goes the other way as well, as people interested in the air quality around Lancaster are probably not too interested in random book reviews, cycling stats and triathlons.
Air quality
Air Quality in Galgate – Part III
In this blog post I continue my look at the appalling air quality in the small village of Galgate, located a few miles south of Lancaster. In the first part here, I carried out some simple air quality modelling and assessed how bad the situation could/will become if developments are continued to built at the current rate. In the second part here, I looked at an air quality assessment that was submitted with a proposal to build 50 new dwellings. In that report, DEFRA’s Technical Guidance was followed, which is far too optimistic on future vehicle emissions, and hence suggested that there would be no problems with air quality by 2017. Quite obviously the current guidance isn’t worth the paper it’s written on.
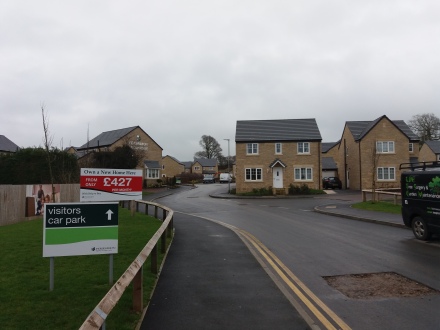
In this post I will be looking at another new housing development, this time off Stoney Lane. In the image below, the badly drawn black line is the border of this new development. The Galgate Air Quality Management Area (AQMA) can also be seen, along with the Ancient Woodlands of Cockshades and Little Cockshades.

This development is almost finished, and the houses don’t look too bad, if slightly generic.

As with my previous analysis, an air quality assessment was required, but this time the local authority insisted that 2013 vehicle emission factors should be applied to the 2019 opening year. This assumes that there will not be any improvement in vehicle pollution, although there probably will be some. The real world vehicle emissions of diesels has not improved as much as expected, despite new EU Legislation. Volkswagon scandal anyone? The air quality assessment was once again written by GEM Air Quality LTD. The assessment also takes into account any committed developments that have already been given the go ahead, which is industry standard.
First off, the development is expected to generate 395 vehicle movements per day along Stoney Lane. When this development and the committed developments are included, there is expected to be an increase of 1500-1700 vehicles per day through the A6 crossroad in Galgate. This is through the AQMA. The transport data was supplied by i-Transport LLP, a firm that I’ve never worked with, although these figures do sound fairly realistic.
So what does the air quality assessment say about the air quality in Galgate in 2019. The report was written in January 2015, and a couple of months later the Institute of Air Quality Management (IAQM) issued new guidance with respect to planning and housing. Previous guidance allowed for a certain amount of interpretation, while the new guidance is quantitative, with no wiggle room. The relevant section can be seen below.

The results from the Stoney Lane development, using the new guidance, place the impacts as ‘Slight’ to ‘Moderate’. When the other committed developments are included, the impacts are ‘Moderate’ to ‘Substantial’. It doesn’t get any worse than ‘Substantial’, and my opinion is that ‘Substantial’ should be replaced with ‘Holy Sh*t’.
The air quality assessment written by GEM includes some mitigation measures for the vehicle impacts. In full, these are to plant a few trees, and the developer may want to supply some electric vehicle charging points. Completely useless.
What is interesting is that the Environmental Health Officer with Lancaster Council recommended refusal based on the air quality assessment. In my opinion this was the correct decision. Somewhere along the line, decisions were made that the health of local residents in Galgate is not as important as new housing developments. If I lived along the A6 in Galgate I wouldn’t be happy with this.
In Part IV of my series of blogs I will look at methods that could improve the air quality in Galgate.
Wigan Air Quality
I’ve blogged about the unusual Greater Manchester Air Quality Management Area (AQMA) before, (https://beardsandtriathlons.wordpress.com/2017/02/12/commuting-and-air-quality/) and I’ve shown part of it once again, focusing on Wigan town centre. The green splodges are sections of the AQMA. I get to cycle through this twice a day.

The AQMA suggests that the air quality in Wigan is poor, but are there any monitored results? I’m glad you asked me that, because according to the Greater Manchester Air Quality website there are quite a few diffusion tubes in the area. I know this because I have read the 2016 Annual Status Report. This report states that because there are 260 diffusion tubes in Greater Manchester, the results are not in the report, but in an attached file and in the appendix. The attached file isn’t attached, obviously, and the appendix isn’t available online. I have emailed a couple of times, but I haven’t had a reply yet.
Without monitored results, let us assume that the air quality in Wigan is poor, hence the AQMA. So, why is the air quality in Wigan poor? Many of the buses are old and have high pollutant emissions. When London, Guildford and other more affluent areas down south invest in new buses, where do you think the old ones go? They gradually migrate north, to Wigan, Sheffield, Barnsley and eventually onto Inverness.
Buses though, only account for some of the pollution. A much larger proportion comes from cars. If you’ve ever had the misfortune to drive into Wigan, you would be able to testify to the fact that cars are everywhere. Most of them are moving slower than I do on a bicycle, with congestion and tailbacks the norm.

The above image is again Wigan town centre. In this small area there are 12 car parks, as well as on street parking on almost every road. An easy and quick win would be to close a few of them. If there is nowhere for people to park they might walk, cycle or use public transport. Alternatively, they might go somewhere else, and Wigan can’t really afford to lose jobs, shoppers or tourists. Studies have shown that non car drivers actually spend far more in local shops, so making Wigan less car centric would actually benefit the city, but just try telling that to local Councillors.
The car parks could be phased out over a number of years, in conjunction with improving facilities for pedestrians and cyclists, adding bus lanes and generally making the place nicer. The solution is there, right in front of our eyes.
If you design a city for cars and traffic, you’ll get a city full of cars and traffic. Why don’t we build a city for people and places?
Air Quality in Galgate – Part II
Welcome to Part II of my series of blogs about the air quality in the small village of Galgate a few miles south of Lancaster. In Part I, I did some air quality modelling and suggested that the air quality in Galgate is only going to get worse. Part II looks at a case study from a development in Galgate that has just been completed. Looks quite nice.
Towards the end of 2012 a planning application was made for 50 residential units. The new access road would be built directly off the A6 in Galgate, south of the crossroads and north of the railway bridge. The image below once again shows the location of the Air Quality Management Area (AQMA) in Galgate.

Every trip generated by this development would have to pass through the AQMA, so an air quality assessment was required. It was prepared by Gem Air Quality Consultants Ltd and I’ve had a good look through it. Documents related to a planning application are all available on the Lancaster Council website, although they can take a bit of hunting. The report is concise and well written, although guidance has changed in the last couple of years. The air quality modelling was done using the proprietary software ADMS, rather than the free DMRB, which was what I used in Part I.
An air quality assessment will model the air quality for the last full year before the application, so in this case, the report was written in 2012, with the data used in the modelling from 2011. An assessment will then use the verification results to model a future year scenario, generally five years later, in this instance 2017. The future year will model the air quality both with and without the development, so that the impacts of the development on its own can be shown.
Gem have used the same diffusion tube locations that I did, as can be seen on the image above, but they have also modelled them for the opening year scenario. I have got hold of diffusion tube results from 2015 so we can compare the actual results with the modelled results for 2017. I know there is a couple of years difference, but the results should be similar.
The results from the diffusion tubes at locations V, Z and ZC in 2011 were, 43, 41 and 37 micrograms per cubic meter. In 2015 the concentrations at all three sites had increased, so the air quality has got worse. The results from the air quality assessment for 2017, modelled the concentration at the diffusion tube locations as 31, 30 and 27. This is a very big improvement in air quality, which has not materialised. This is important, as planning decisions can hinge on things like this, so why the big difference.
The first thing to note is that this isn’t an issue with the air quality assessment, this was done using the most up to date guidance at the time. The problem is primarily with the emission factors toolkit. This is a spreadsheet that calculates the emissions from vehicles on the road in the UK, and as older cars are scrapped and replaced with more efficient newer cars, the volume of polluting emissions decreases. Unfortunately, real world emissions have not been decreasing as quickly as expected for various reasons, for example, the Volkswagon diesel scandal.
Many local authorities realised that air quality assessments did not resemble real world scenarios, so now most assessments will include future scenarios modelled with emission factors from the present day. This will give a ‘worst case’ scenario, although as I have demonstrated here, ‘worst case’ is probably what is happening in Galgate.
Finally, is there anything that I would add to the assessment that was done for this development. Guidance has moved on, so you would have to include something about the railway line passing so close to the new houses. I would also liked to have seen something about designated habitats, for example Sites of Special Scientific Interest, of Local Nature Reserve. Close to the proposed development there are two ancient woodlands, Cockshades Wood and Little Cockshades Wood, as can be seen in the image below.

From the guidance, neither of these woods are close enough to the development to be effected by it, but it’s always nice to know that a consultant has looked at these things, because the next assessment might be sharing a border with a conservation area.
Part III will examine a more recent air quality assessment from another development in Galgate, coming soon. In the mean time, if you want me to have a look at an air quality assessment for a development that you have concerns about, send me a message.
Commuting and Air Quality
Part of my commute involves cycling from Wigan train station to my office in Leigh; the red line in the image below. The blue splodges are Air Quality Management Areas (AQMAs). In the smaller inset map you can see the Greater Manchester AQMA in the middle (lots of splodges), with the Liverpool AQMA to the west and Sheffield’s AQMA to the east.

The Manchester AQMA was created with air quality modelling software, so only those areas where the annual mean concentration is above a certain level are highlighted. You can see the various splodges that I cycled through in Wigan, with a few more at busier junctions all the way to Leigh.

I would have liked to have used the ‘clip’ function in QGIS to calculate exactly how far I cycle each day inside the AQMA, but my GPS route doesn’t have the required attributes to do the job. I’m sure there is a way of converting to the correct format, but my knowledge of GIS isn’t the best. My commute is just over 11 km, with approximately 1 km inside various sections of the Greater Manchester AQMA.
Most of my journey is busy with traffic, so I am probably exposed to quite high levels of pollution, but studies have shown that the exercise from cycling benefits me far more than the exposure.
As I near the end of my commute in Leigh, there is another splodge of AQMA right on top of the office where I work, quite apt for a bunch of air quality scientists.

The NO2 annual mean objective is 40 ug/m3 (micro grams per cubic meter), and as any good air quality scientist will tell you, if you are exposed to pollution concentrations above 40 you will die tomorrow, and less than 40 you will live forever. I’m joking of course, but this is why air quality is an objective and not a hard and fast ‘level’, which any city in the UK should be able to achieve, if it is a priority. Cars would appear to be more of a priority in most cities, especially between Wigan and Leigh.
Air Quality in Galgate
The air quality in most UK cities is appalling. London has managed to exceed air quality objectives for the year by 5th January. Lancaster is no exception, with a large Air Quality Management Area (AQMA) covering the whole of the one way system, as well as a couple of smaller AQMAs in Carnforth and Galgate.
Local authorities have a duty to monitor and report on the air quality in their area, and any areas where the quality is likely to exceed objectives, an AQMA has to be declared. The authority also has to come up with a plan on how to improve the air quality, although this is as far as the legal obligation goes.
Write a plan, publish it, everyone ignores it, air quality doesn’t improve, job done.
Improving urban air quality is easy, as approximately 70-80% of all pollution comes from motor vehicles. Reduce the volume of traffic, improve air quality, towns and cities become more liveable and fewer people die because of poor air quality. Everybody wins. I’ve never heard anyone comment that Amsterdam is a lovely city, but what it needs is more cars.
Back to Galgate, which is a small town a few miles south of Lancaster. Galgate straddles the A6, and current measurements from the Dept. for Transport has over 15,ooo vehicles a day passing through the its centre. The town is located between junction 33 of the M6 and Lancaster University, so without moving the motorway junction there is no alternative route.
Why am I blogging about it? My PhD looked at urban air quality, so I could be called an expert. This blog post, therefore, has two purposes; firstly to estimate what the annual mean NO2 concentration is for people living in the houses alongside the A6, and secondly to gain some valuable experience using the software Q-GIS. At Uni I used a Geographic Information System (GIS) for a great deal of analyses in my PhD, but the program that I was using wasn’t free. Q-GIS is an alternative which is open source, so completely free.
Back to the first purpose, Lancaster Council has placed five Diffusion Tubes in Galgate. These are a cheap and easy method to measure air quality and are generally attached to lamposts, being replaced each month (the diffusion tube, not the lampost). The cap at the bottom is removed once the tube has been deployed. A month later it is sent to a laboratory and a couple of weeks later you get the results.

Results from the five tubes in Galgate for 2014 are available from the Lancaster air quality webpage. This data, along with traffic data from the DfT, were used to estimate, or “model” the air quality for local residents in Galgate.
Specialists have many options to model air quality, but the two most commonly used are ADMS and DMRB. ADMS is a fairly complicated Gaussian plume dispersion model, which also costs almost £2000 for a single one year license. I use it extensively at work.
DMRB stands for the Design Manual for Roads and Bridges, which includes a free to use, Excel based spreadsheet which is reasonably straight forward to use for non specialists. Unfortunately it is not available to download at the present time. This is either because a new version will be released soon, or because it will be discontinued. I hope that it isn’t the latter for the reasons I stated.
Back to Galgate, and the map below (produced using Q-GIS and using Open Street Map), shows the centre of Galgate, the extent of the AQMA and the position of the diffusion tubes. The yellow road through the middle is the A6. It isn’t my best cartography work, but it is the first time that I’ve used Q-GIS, so I will improve.

Now for the complicated bit. Using information form the Council I knew how far each diffusion tube was from the kerb, and using traffic data from the DfT I could model the NO2 concentration at each diffusion tube. The road NOx results are then run through another free Excel spreadsheet, the NOx to NO2 calculator, to calculate the modelled NO2 concentration. These are used to verify the modelled results alongside the measured results from the Council. I ended up with a verification factor of 1.6916, which is good for any air quality model.
I then picked two houses, one south of the crossroads where the front door opened directly onto the pavement, and one north of the crossroads with a very small front garden. I then ran DMRB once again, multiplied the road NOx concentration by the verification factor, ran these results through the NOx to NO2 calculator, and here are the results.
- North residential property 37.07 ug/m3
- South residential property 37.97 ug/m3
The units are micro-grams per cubic meter, and the air objective is only 40 ug/m3. The people living in these houses are being subjected to extremely poor air quality all of the time.
If you have driven or cycled through Galgate, or used the train, you can’t help but notice all the new properties that have been built. I then ran the model once again but with a substantial increase in traffic to reflect all of the new properties. Revised results are below:
- North residential property 38.62 ug/m3
- South residential property 39.58 ug/m3
The Institute of Air Quality Management has produced a handy guide to compare the increase new developments have upon existing residential properties.
The change in concentration at the two properties is 3.88% and 4.03%, relative to 40 ug/m3. Using the chart above this is a “Moderate” impact. Moderate doesn’t sound too bad, but there is only one level higher. “Substantial” should be renamed “Holy S*** that’s bad”.
If you’ve seen the news, you might have heard about the new Garden Villages that are going to be built. One of them is planned for Bailrigg, the area of land just north of the University. The proposal is for 3500 dwellings. Standard traffic consultant figures estimate that each dwelling will result in four car movements per day. That is potentially a lot more cars through Galgate, although the Garden Village plans do include ideas about moving the motorway junction.
My own view is that local authorities should have a legal requirement to improve air quality, and until they do, it will be business as usual. More roads, more cars and substandard cycling infrastructure.

You must be logged in to post a comment.